For your role · Data analysts and BI
For analysts: join and understand your data
A good question often crosses sources. DataTug keeps them in one project, lets you join across them, and records what columns mean, so the next analysis does not start from a blank ON clause.
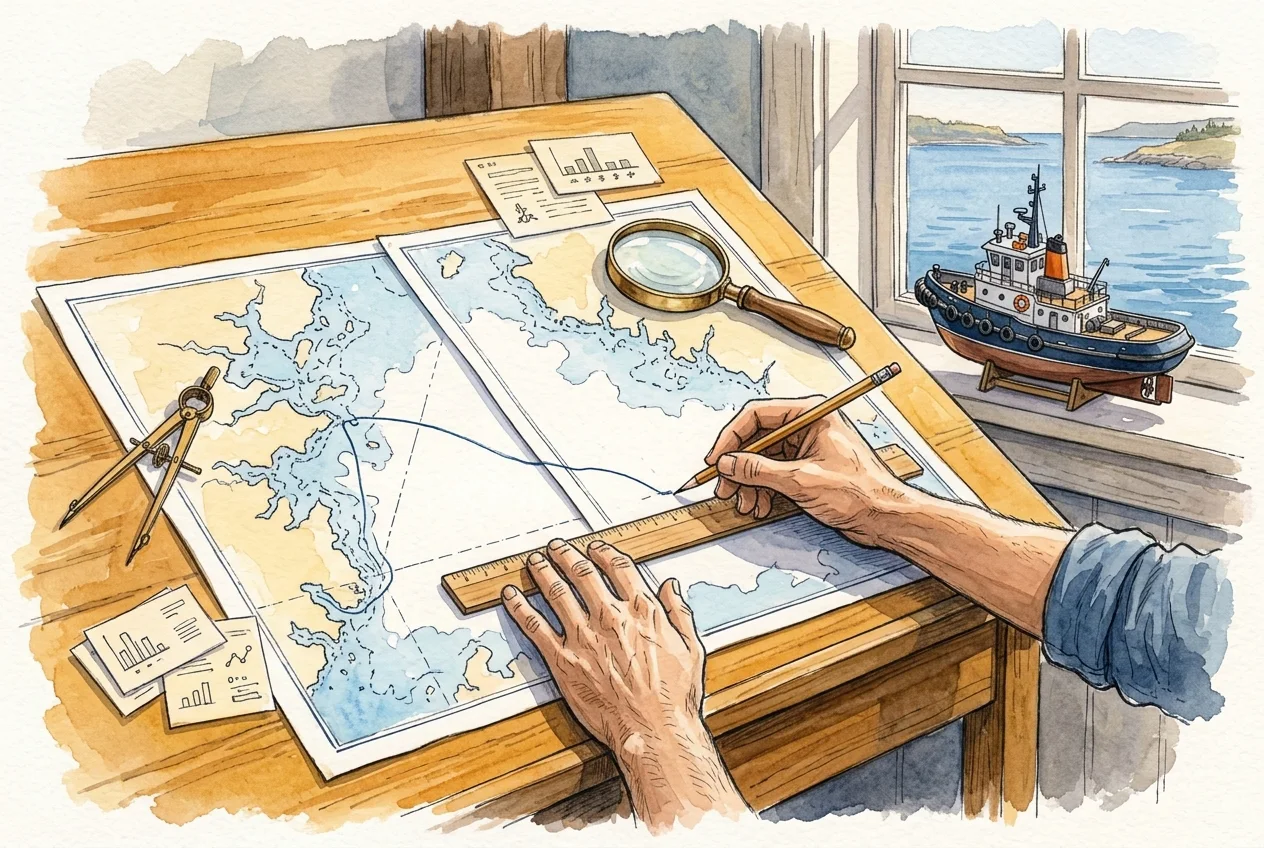
The answer needs two databases, so it starts with two exports and a spreadsheet. And I am never sure the IDs mean the same thing.
Your day
- Exports and spreadsheets. Combining two databases means CSVs and VLOOKUPs, and the numbers drift from the source.
- Columns that look alike. customer_id here and CustID there: the same thing, or not? The person who knows is busy.
- Answers without their query. A chart goes to the meeting; the query that made it stays on your laptop.
One task, before and after: compare sales with support load per customer
Who: Data analysts and BI

Today
4 tools2 hand-offsno shared password
- Export customers and orders from one database, tickets from another.
- Match the IDs in a spreadsheet.
- Ask around what each ID column means.
- Send a screenshot of the chart.

With DataTug
1 workspace0 hand-offsno shared password
Some steps are planned or in development.
- Query both databases from one workspace and join them.Cross-source TugQL joins in the browserIn development
- Record what a column means, so the next person knows which ID is which.Column meaningsAvailable
- Have MeaningGraph suggest the join between two sources (planned).MeaningGraph integrationPlanned
- Share the result as a dashboard or a saved query, not a screenshot.DashboardsAvailable
Each step names the part of DataTug it relies on and that part’s status today. “Planned” and “In development” steps describe where the product is going, not what you can use now.
Solutions for you
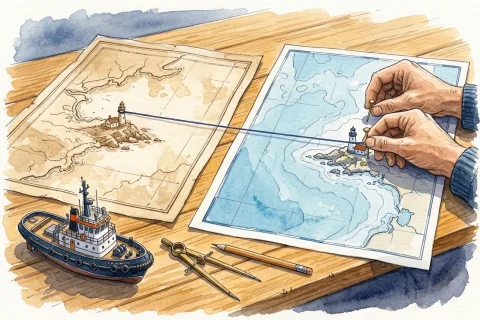 Data UnderstandingKnow what a column means before you join on itRecord what a column means before anyone joins on it.Start here
 Data Exploration & SharingAsk a question across several databases and share the answerJoin across databases without exports, and share the answer as a query, not a screenshot.Start here
Also useful: Data Quality & MonitoringSafe Data Access
Read more: Reconciling exports by hand
Try it on sample data
The public demo project opens in the browser with sample Northwind and Chinook data. No sign-up.
Explore the demo project